
Creating custom dashboards in the back office
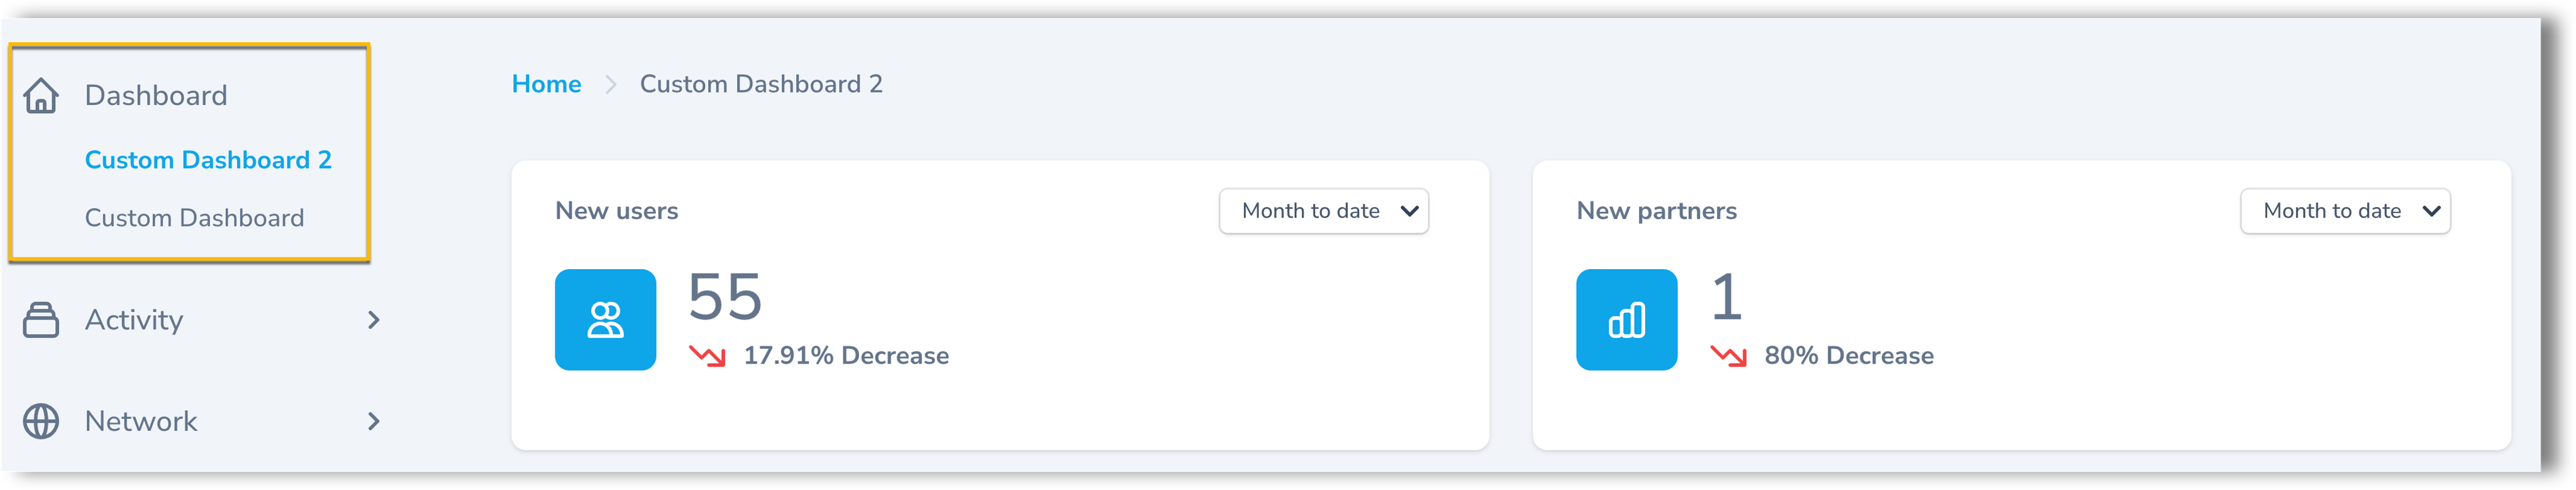
A dashboard is a single page in the back office that brings key metrics together in one place. It shows widgets—interactive cards such as charts, counters, and maps—that surface the information admin users check most often.
Custom dashboards allow you to control what each operator and their users see when they log into the back office. You can create multiple, operator- and role-specific dashboards—each tailored with the widgets and data most relevant to teams like finance, operations, and support. This approach keeps dashboards centrally managed while delivering a focused, data-driven experience for each user.
In this article, you'll learn how to create custom dashboards and manage their visibility.
Before you start
To create and manage custom dashboards, you must have one of the following roles: Org admin (Global or Operator type) or a custom role with the appropriate permissions.
How it works
To set up a dashboard, first create it and then add widgets—either system or custom ones. Dashboards and widgets are both scoped per operator: you can tie a dashboard to a specific operator, or leave it global so it's visible to all operators. Next, assign the dashboard to one or more roles to control which users see it. Widgets are shown only to users who have permission to access the dashboard and to view the widget's source data; if the data permission is missing, the widget is hidden.
The back office includes a default main dashboard that acts as the entry view. It can't be deleted, but it can be disabled or unassigned from roles, provided each role still has at least one enabled dashboard. By creating and assigning custom dashboards, you can personalize the entry experience for every role.
Creating a custom dashboard
NoteAll fields marked with a red asterisk (*) are mandatory and must be filled in before you can save the dashboard.
To create a custom dashboard:
- In the back office main menu, go to System > Dashboards and click Create dashboard.
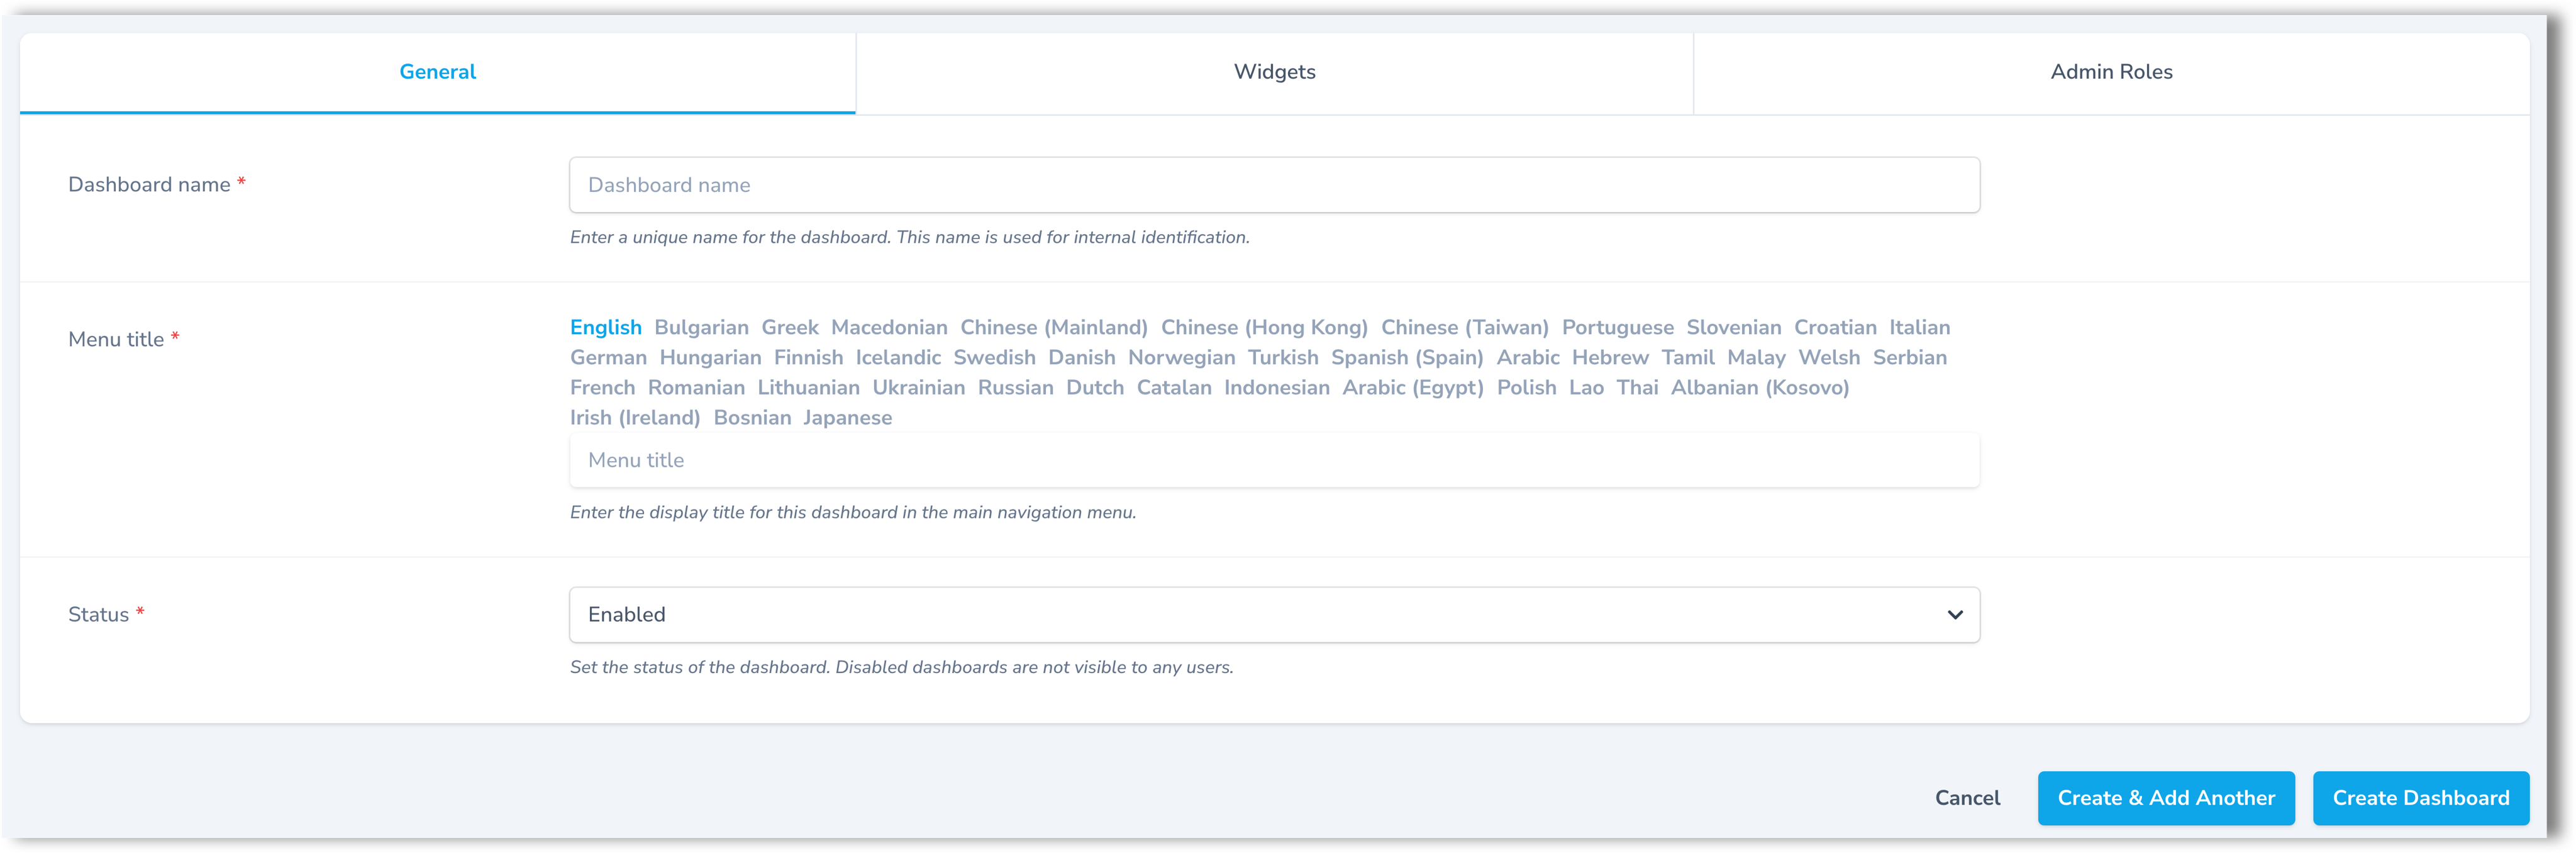
- In the General tab:
-
In the Dashboard name* field, enter a unique internal name for the dashboard, i.e. the name of the resource.
-
In the Menu title* field, enter a name for the dashboard as it will appear in the back office main menu. If your back office supports multiple languages, use the language tabs to provide a translation for each language.
-
From the Status* drop-down menu, choose Enabled to make the dashboard visible to admin users, or Disabled to hide it.
-
From the Operator drop-down menu, choose which operator can see this dashboard. Leave it empty to make it visible to all operators.
-
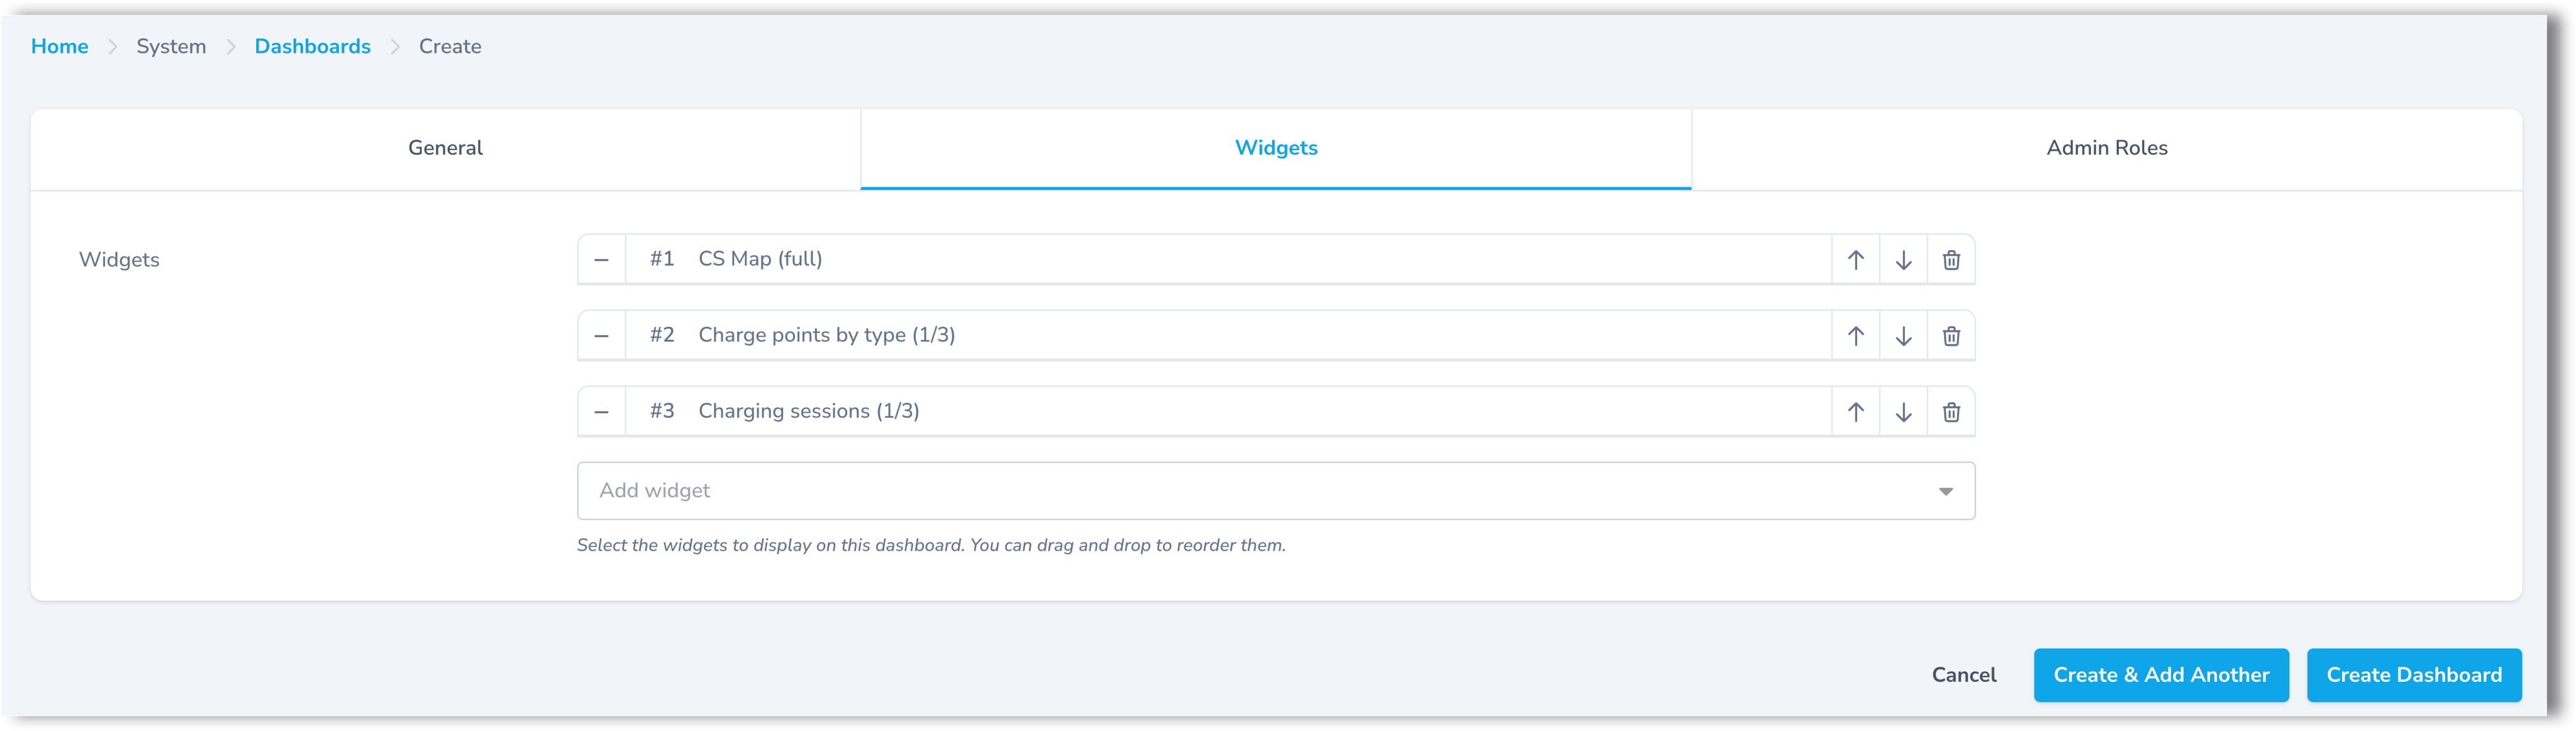
- In the Widgets tab, from the Widgets drop-down menu, select the widgets to display on the dashboard. The list includes both built-in system widgets and any custom widgets you've already created. Each widget can be added to more than one dashboard if needed. To learn how to create custom widgets, see Creating custom widgets in the back office.
ImportantWhen a dashboard is scoped to a specific operator, you can add only that operator's widgets and global widgets (including the built-in system widgets). Widgets belonging to a different operator can't be added. A dashboard with no operator selected (global) can include global widgets only.
TipThe dashboard page (Home > [Dashboard name]), uses a three-column grid with no row limit. In other words, columns are fixed (3) but rows can grow as needed.
The value in brackets next to each widget's name indicates its layout width. For example, (1/3) means the widget spans one of the three columns. If a widget shows (Full), it spans all three columns of the row.
For a list of all system widgets that are currently supported, see the table below.
System widgets
| N | Widget name | Layout | Description |
|---|---|---|---|
| 1 | Active sessions | 1/3 | Real-time count of ongoing charging sessions |
| 2 | All open issues | 1/3 | Doughnut chart of all open issues grouped by priority level (Highest, High, Medium, Low) |
| 3 | Charge points by type | 1/3 | Pie chart showing distribution of charge points by access type (Public, Private, Personal) |
| 4 | Charge points with Plug & Charge | 1/3 | Doughnut chart showing the proportion of charge points with Plug & Charge enabled vs. disabled |
| 5 | EVSEs by connector type | 1/3 | Doughnut chart showing distribution of EVSEs by connector type (top 3 shown individually, rest grouped as "Other") |
| 6 | Expiring partner contracts | 1/3 | Count of partner contracts expiring within a configurable time range (30, 60, or 90 days) |
| 7 | Faults & connectivity loss | 1/3 | Count of charge points with active faults or connectivity issues |
| 8 | Location overview | Full | Interactive widget to select a location and view its charge points, EVSEs, connector types, and current statuses |
| 9 | Locations by city | 1/3 | Doughnut chart showing distribution of locations by city (top 3 shown individually, rest grouped as "Other") |
| 10 | Locations map | Full | Interactive map showing charging network locations with filtering options |
| 11 | Locations with blocked EVSEs | 1/3 | Count of parking spaces with Blocked/Unavailable status (requires parking sensors integration) |
| 12 | My open issues | 1/3 | Doughnut chart of open issues assigned to the current admin user, grouped by priority level |
| 13 | My revenue share / Partner revenue share | 1/3 | Total revenue share amount for the current partner |
| 14 | Needs attention | Full | Three key counters: charge points with faults, sessions with suspended billing, and open issues |
| 15 | Network online status | 1/3 | Doughnut chart showing charge points by connectivity status (Online, Temporarily unavailable, Long-term unavailable, Never connected) |
| 16 | New charge points | 1/3 | Recently added charge points to the system |
| 17 | New partners | 1/3 | Recently onboarded partners |
| 18 | New users | 1/3 | Recently registered EV drivers in the system |
| 19 | Open issues by category | 1/3 | Doughnut chart of all open issues grouped by issue category |
| 20 | Plug & Charge sessions | 1/3 | Gauge chart showing the proportion of Plug & Charge sessions relative to total sessions |
| 21 | Sessions | 1/3 | Total count of charging sessions with time-based filtering |
| 22 | Sessions overview | Full | Combined line/bar chart with session count and energy consumption trends, plus stat boxes for total sessions, energy, active sessions, and current power |
| 23 | Sessions revenue | Full | Stacked area chart showing revenue trends with operator and partner share breakdown, plus stat boxes for total revenue, operator share, partner share, and average per session |
| 24 | Sessions with suspended billing status | 1/3 | Count of charging sessions that have Suspended billing status |
| 25 | Total energy | 1/3 | Total energy consumed across all charging sessions (in kWh) |
| 26 | Total revenue (by partner revenue and expenses) | 1/3 | Calculated total revenue factoring in partner revenue share and operational expenses |
| 27 | Total revenue (by sessions) | 1/3 | Total revenue calculated from charging session costs |
NoteIf there is an active SSO (Single Sign-On) integration, a Welcome! banner widget is automatically displayed on the dashboard for SSO admin users who have not yet been assigned a role. This widget is managed by the system and cannot be manually added or removed.
Use the arrows to rearrange the widgets and change the order in which they appear on the dashboard. Click the Delete icon to remove a widget from the list.
TipOnce a widget is deleted from a dashboard, it cannot be re-added immediately. You must first save the changes to the dashboard, then reopen it for editing to add the widget again.
- In the Admin roles tab, from the Roles drop-down, select the roles to assign this dashboard to. It will appear last in the Dashboard section for users with that role.
TipTo change the order of the dashboards, go to System > Roles, open the role, and reorder dashboards on that role's Dashboards tab. For more details, see Arranging dashboards per role.
-
Click Create dashboard.
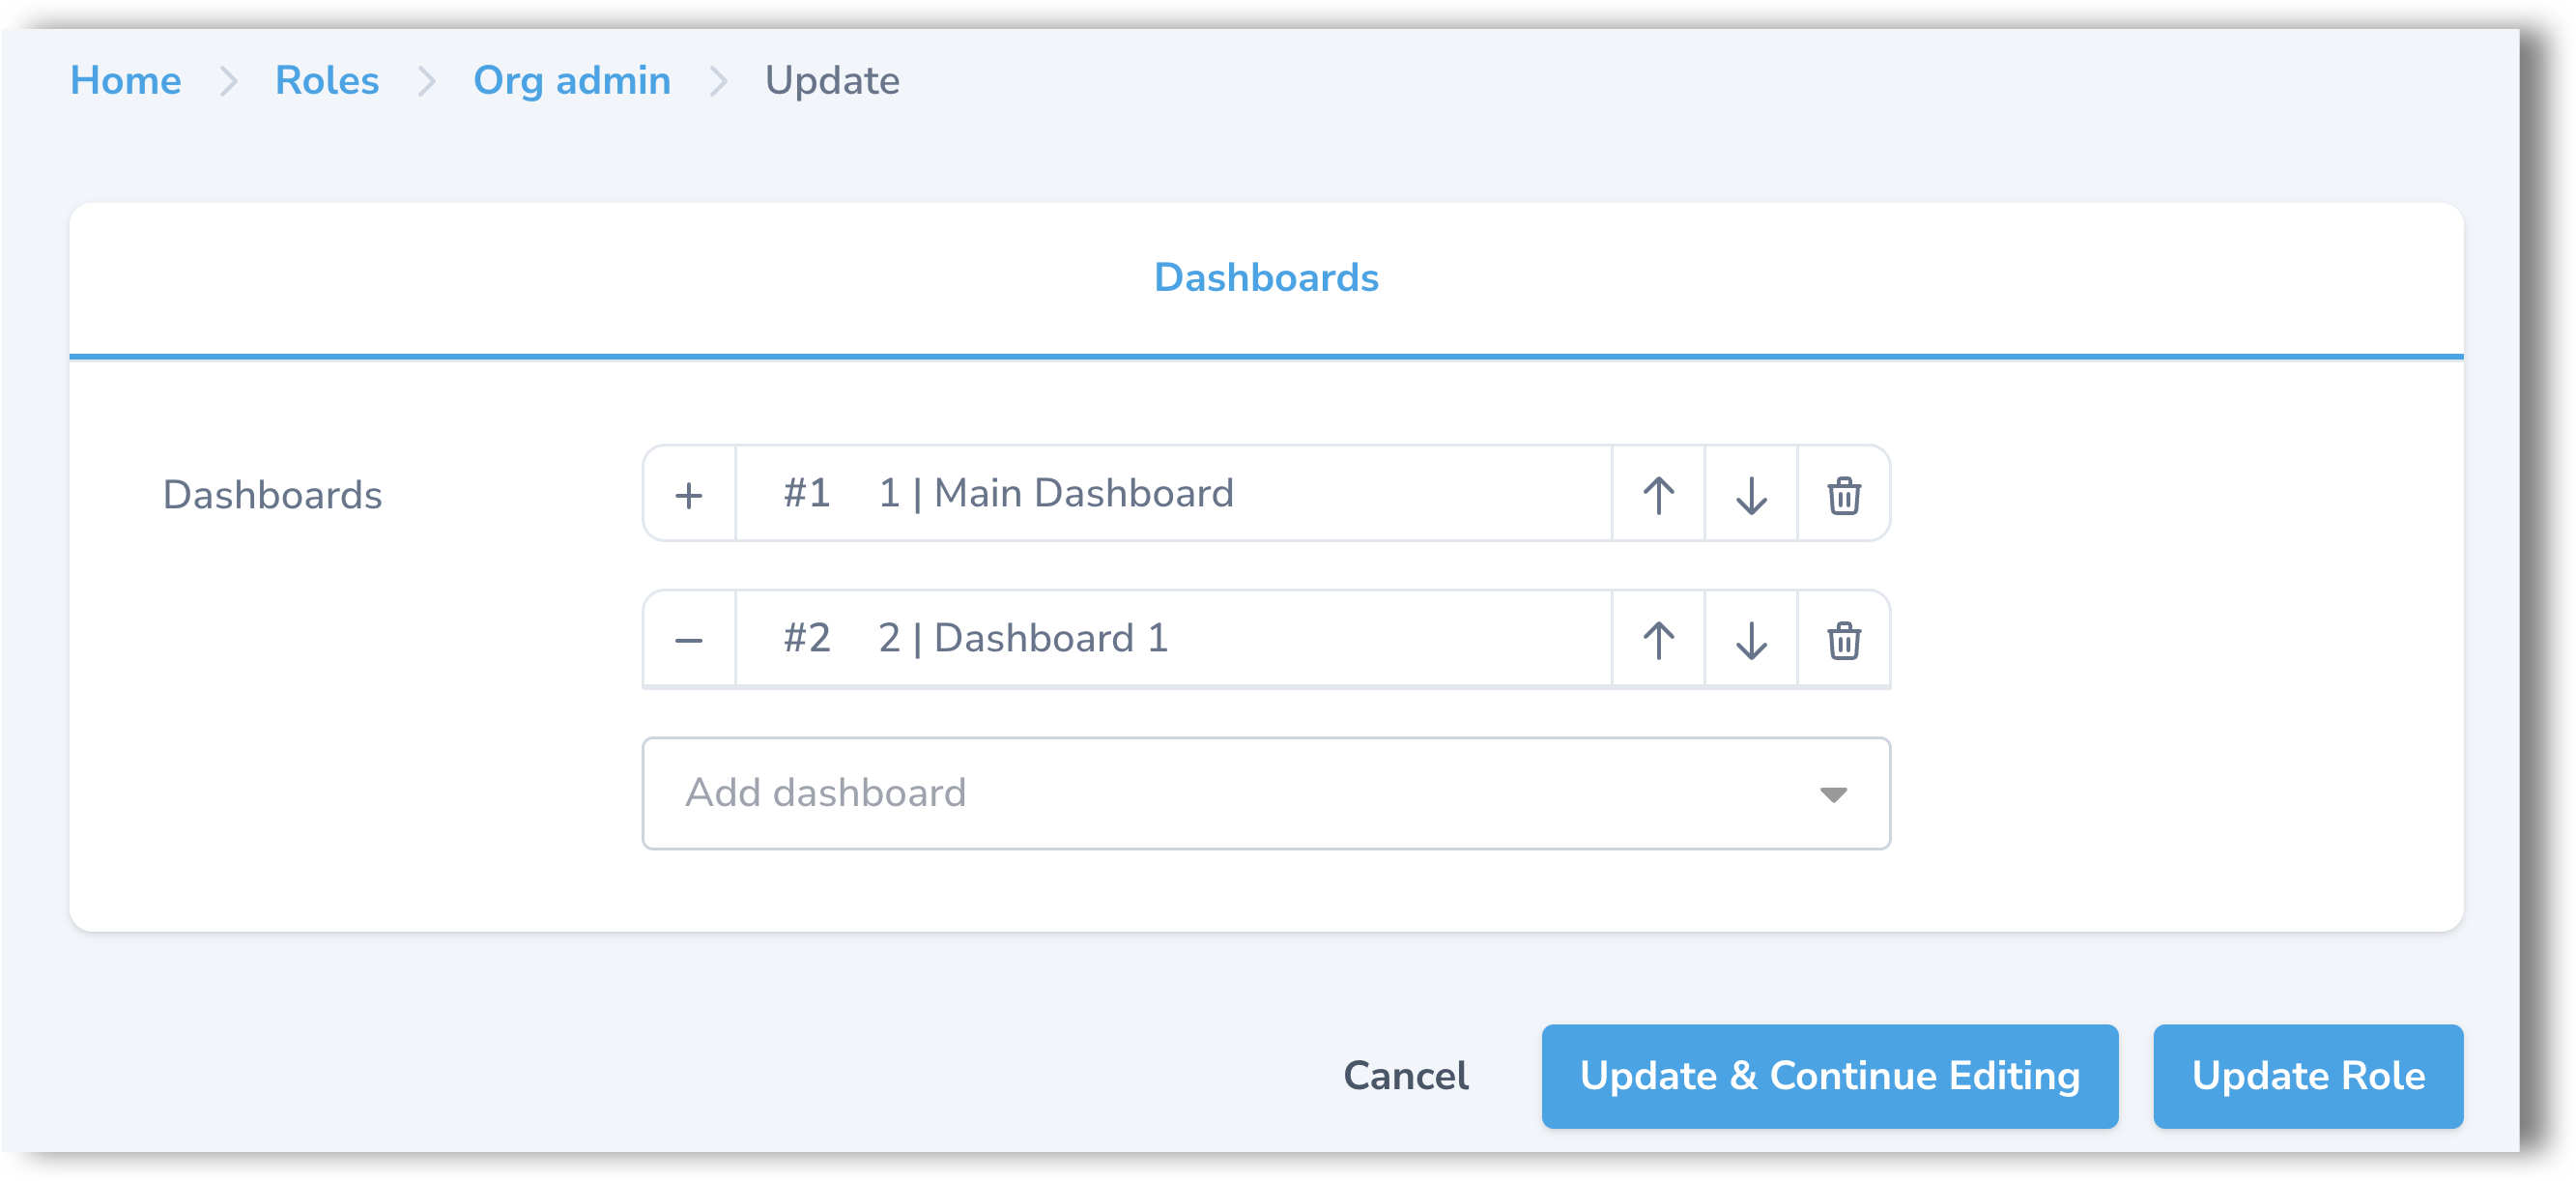
Arranging dashboards per role
After creating a dashboard and assigning it to a role, you can set the order in which dashboards appear in the Dashboard section for users with that role.
- In the back office main menu, go to System > Roles.
- Find the role you want to configure and click the Edit icon.
- In the Dashboards tab, use the arrows to reorder the dashboards. To add more, select them from the drop-down menu.
- Click Update role.
Updated about 1 month ago